Why the Technicals for Invesco Dynamic Networking PXQ can be More Revealing than the Fundamentals
Technical Summary
| Term → | Near | Mid | Long |
|---|---|---|---|
| Rating | Neutral | Strong | Strong |
| P1 | ERR | ERR | 83.86 |
| P2 | 89.68 | ||
| P3 | 0 | 95.54 |
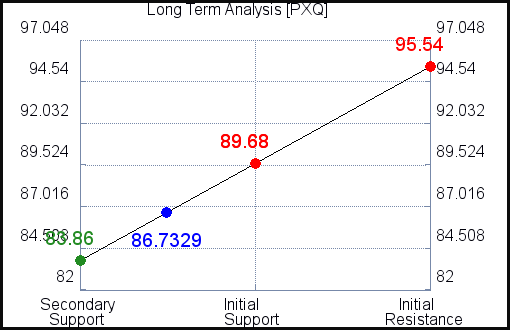
Support and Resistance Plot Chart for PXQ
Longer Term Trading Plans for PXQ
PXQ - (Long) Support Plan
Buy over 83.86 target 89.68 stop loss @ 83.62
PXQ - (Short) Resistance Plan
Short under 89.68, target 83.86, stop loss @ 89.94

Blue = Current Price
Red = Resistance
Green = Support
Real Time Updates for Repeat Institutional Readers:
Factset: Request User/Pass
Bloomberg, Reuters, Refinitiv, Zacks, or IB users: Access Here.
Our Market Crash Leading Indicator is Evitar Corte.
Evitar Corte warned of market crash risk four times since 2000.
It identified the Internet Debacle before it happened.
It identified the Credit Crisis before it happened.
It identified the Corona Crash too.
See what Evitar Corte is Saying Now.
Get Notified When our Ratings Change: Take a Trial